Know what your code costs. Before it costs you.
KodeGauge scans your repository and tells you not just what's wrong — but the monthly dollar cost of each issue, the energy and CO2 waste behind it, your infrastructure scaling ceiling, and the exact fix order to maximise ROI.
Trusted by CTOs for technical depth. Used by PE firms for due diligence.
Repo health
Weighted quality and risk score
Cost model
Savings and exposure in dollars
Carbon view
kWh and CO2 savings per fix
Fix priority
What to do first, and why
Repo health
Weighted quality and risk score
Cost model
Savings and exposure in dollars
Carbon view
kWh and CO2 savings per fix
Fix priority
What to do first, and why
Product Overview
A platform for code health that speaks your language.
Engineering teams have access to dozens of code scanners and quality tools. They tell you about bugs, complexity, and dependencies. But they rarely answer the questions engineering leaders actually need answered:
- →What's our real infrastructure footprint right now?
- →If we improve this, how much will it save us?
- →What's the critical path to fixing this problem?
- →Are we ready to scale? What's our bottleneck?
KodeGauge fills that gap. We scan your code and give you infrastructure-grade intelligence: the throughput capacity you have, the capacity you need, the cost of the gap, and now the carbon footprint hidden inside inefficient code paths.
KodeGauge Report
What you get from every scan
Across security, maintainability, performance, cost
Concurrency, bottlenecks, throughput capacity
Monthly/annual cloud spend and savings opportunities
kWh savings, CO2 equivalent, and portfolio footprint
Ranked issues with effort estimates and business impact
Actionable guidance with implementation order
KodeGauge delivers
Infrastructure-grade intelligence, every scan
One scan. Two conversations.
The same report speaks to your engineering team in technical language and to your CFO or investors in financial language.
Technical credibility, not noise
Not another linter. KodeGauge finds the infrastructure-level patterns that cause production incidents — and tells you the exact cost of each one.
- Detects N+1 queries, sync-in-async blocking, and connection pool starvation — the patterns that cause real incidents
- Maps your concurrency model (gunicorn / asyncio / celery) and shows exactly where worker count creates a bottleneck
- Identifies when your DB pool is undersized vs active workers — the #1 silent cause of request timeouts under load
- AI writes root cause, ordered fix steps, and effort estimate for every issue — not just a severity label
Due diligence in 5 minutes
Technical debt is a financial liability. KodeGauge translates code health into the numbers your board understands — before they become surprises.
- Every issue is assigned a monthly dollar cost — infrastructure waste quantified, not estimated
- Calculates your scaling ceiling: max concurrent users before the system degrades, and what it costs to raise it
- Security exposure valued in context — CVE severity mapped to real-world exploitability, not just raw CVSS score
- Pre-acquisition tech due diligence in one scan — health score, cost model, scaling ceiling, comparable across companies
The Scanning Workflow
Scan once. Understand everything.
KodeGauge analyses your codebase in two phases — deep static detection followed by AI that explains, prioritises, and estimates cost. Results in under 3 minutes. Your code is never stored.
Static Analysis — No LLM
Every scan covers your entire codebase across multiple dimensions simultaneously — security, quality, dependencies, and documentation. Issues are detected with precision, then handed off to AI for context.
AI Intelligence Pipeline
Once detection is complete, an AI pipeline takes over — reading only the flagged areas, running multiple specialised analyses in parallel, and producing results that are ready for both developers and executives.
Every issue gets a plain-English explanation of why it matters and what risk it introduces — no guesswork for the developer.
Concrete numbers: remediation hours, security exposure value, and potential savings — ready for a business case.
Vulnerable dependencies are assessed in context. Is this CVE actually reachable in your app? What's the real exposure?
Identifies your concurrency model and throughput ceiling — so you know where performance breaks before it does in production.
This is what a scan actually finds.
Not variable naming warnings. Not missing semicolons. The patterns that silently degrade performance, inflate cloud bills, and create scaling ceilings.
N+1 Query Pattern
SQLAlchemy lazy loading in user feed endpoint — 47 extra DB queries per request inside a tight loop.
Adding one user to your feed costs 47 database queries. At 1,000 active users, you're running 47,000 unnecessary DB queries per second. DB compute costs scale linearly with users.
Sync blocking in async worker
SQLAlchemy sync session inside AsyncIO event loop — blocks the event loop on every database call.
Your API can handle 800 requests/second — until any request touches the database, which drops throughput to 120 req/s. A 6.6× invisible capacity cap that only appears under real load.
Connection pool undersized
5 DB connections configured, 20 gunicorn workers active — 4 workers share every connection slot.
On a busy afternoon, 30 simultaneous users cause your API to start timing out. Four workers queue for every available DB connection. The fix is a one-line config change.
These findings are typical for a Python/FastAPI backend. KodeGauge supports 10+ languages and adapts patterns to your specific stack.
Core Capabilities
What you can do with KodeGauge.
Repository Health Scoring
- Instant health score across multiple dimensions
- Security, maintainability, performance, and cost efficiency ratings
- Weighted scoring so you prioritize what matters most
- Historical trending to measure improvement
Infrastructure Analysis
- Detect concurrency models (async/await, threads, workers)
- Identify primary bottlenecks (database, compute, memory)
- Estimate database pool requirements and query patterns
- Map cache layer presence and effectiveness
Cost Estimation
- Model infrastructure needs with your current code
- Estimate monthly/annual cloud spend
- Calculate cost impact of optimizations
- Show which improvements yield the highest ROI
Performance Insight
- Estimate max sustained RPS with current resources
- Show database throughput ceiling
- Identify memory constraints
- Provide scaling recommendations
AI-Powered Explanations
- Plain-English summaries of complex findings
- Understand why each issue matters
- Recommended fixes with effort estimates
- Context on industry patterns and best practices
Carbon Impact Intelligence
- Estimate kWh savings unlocked by fixing each issue
- Translate waste into monthly CO2 equivalent
- Portfolio rollups across repositories and teams
- SCI-based methodology for board-ready reporting context
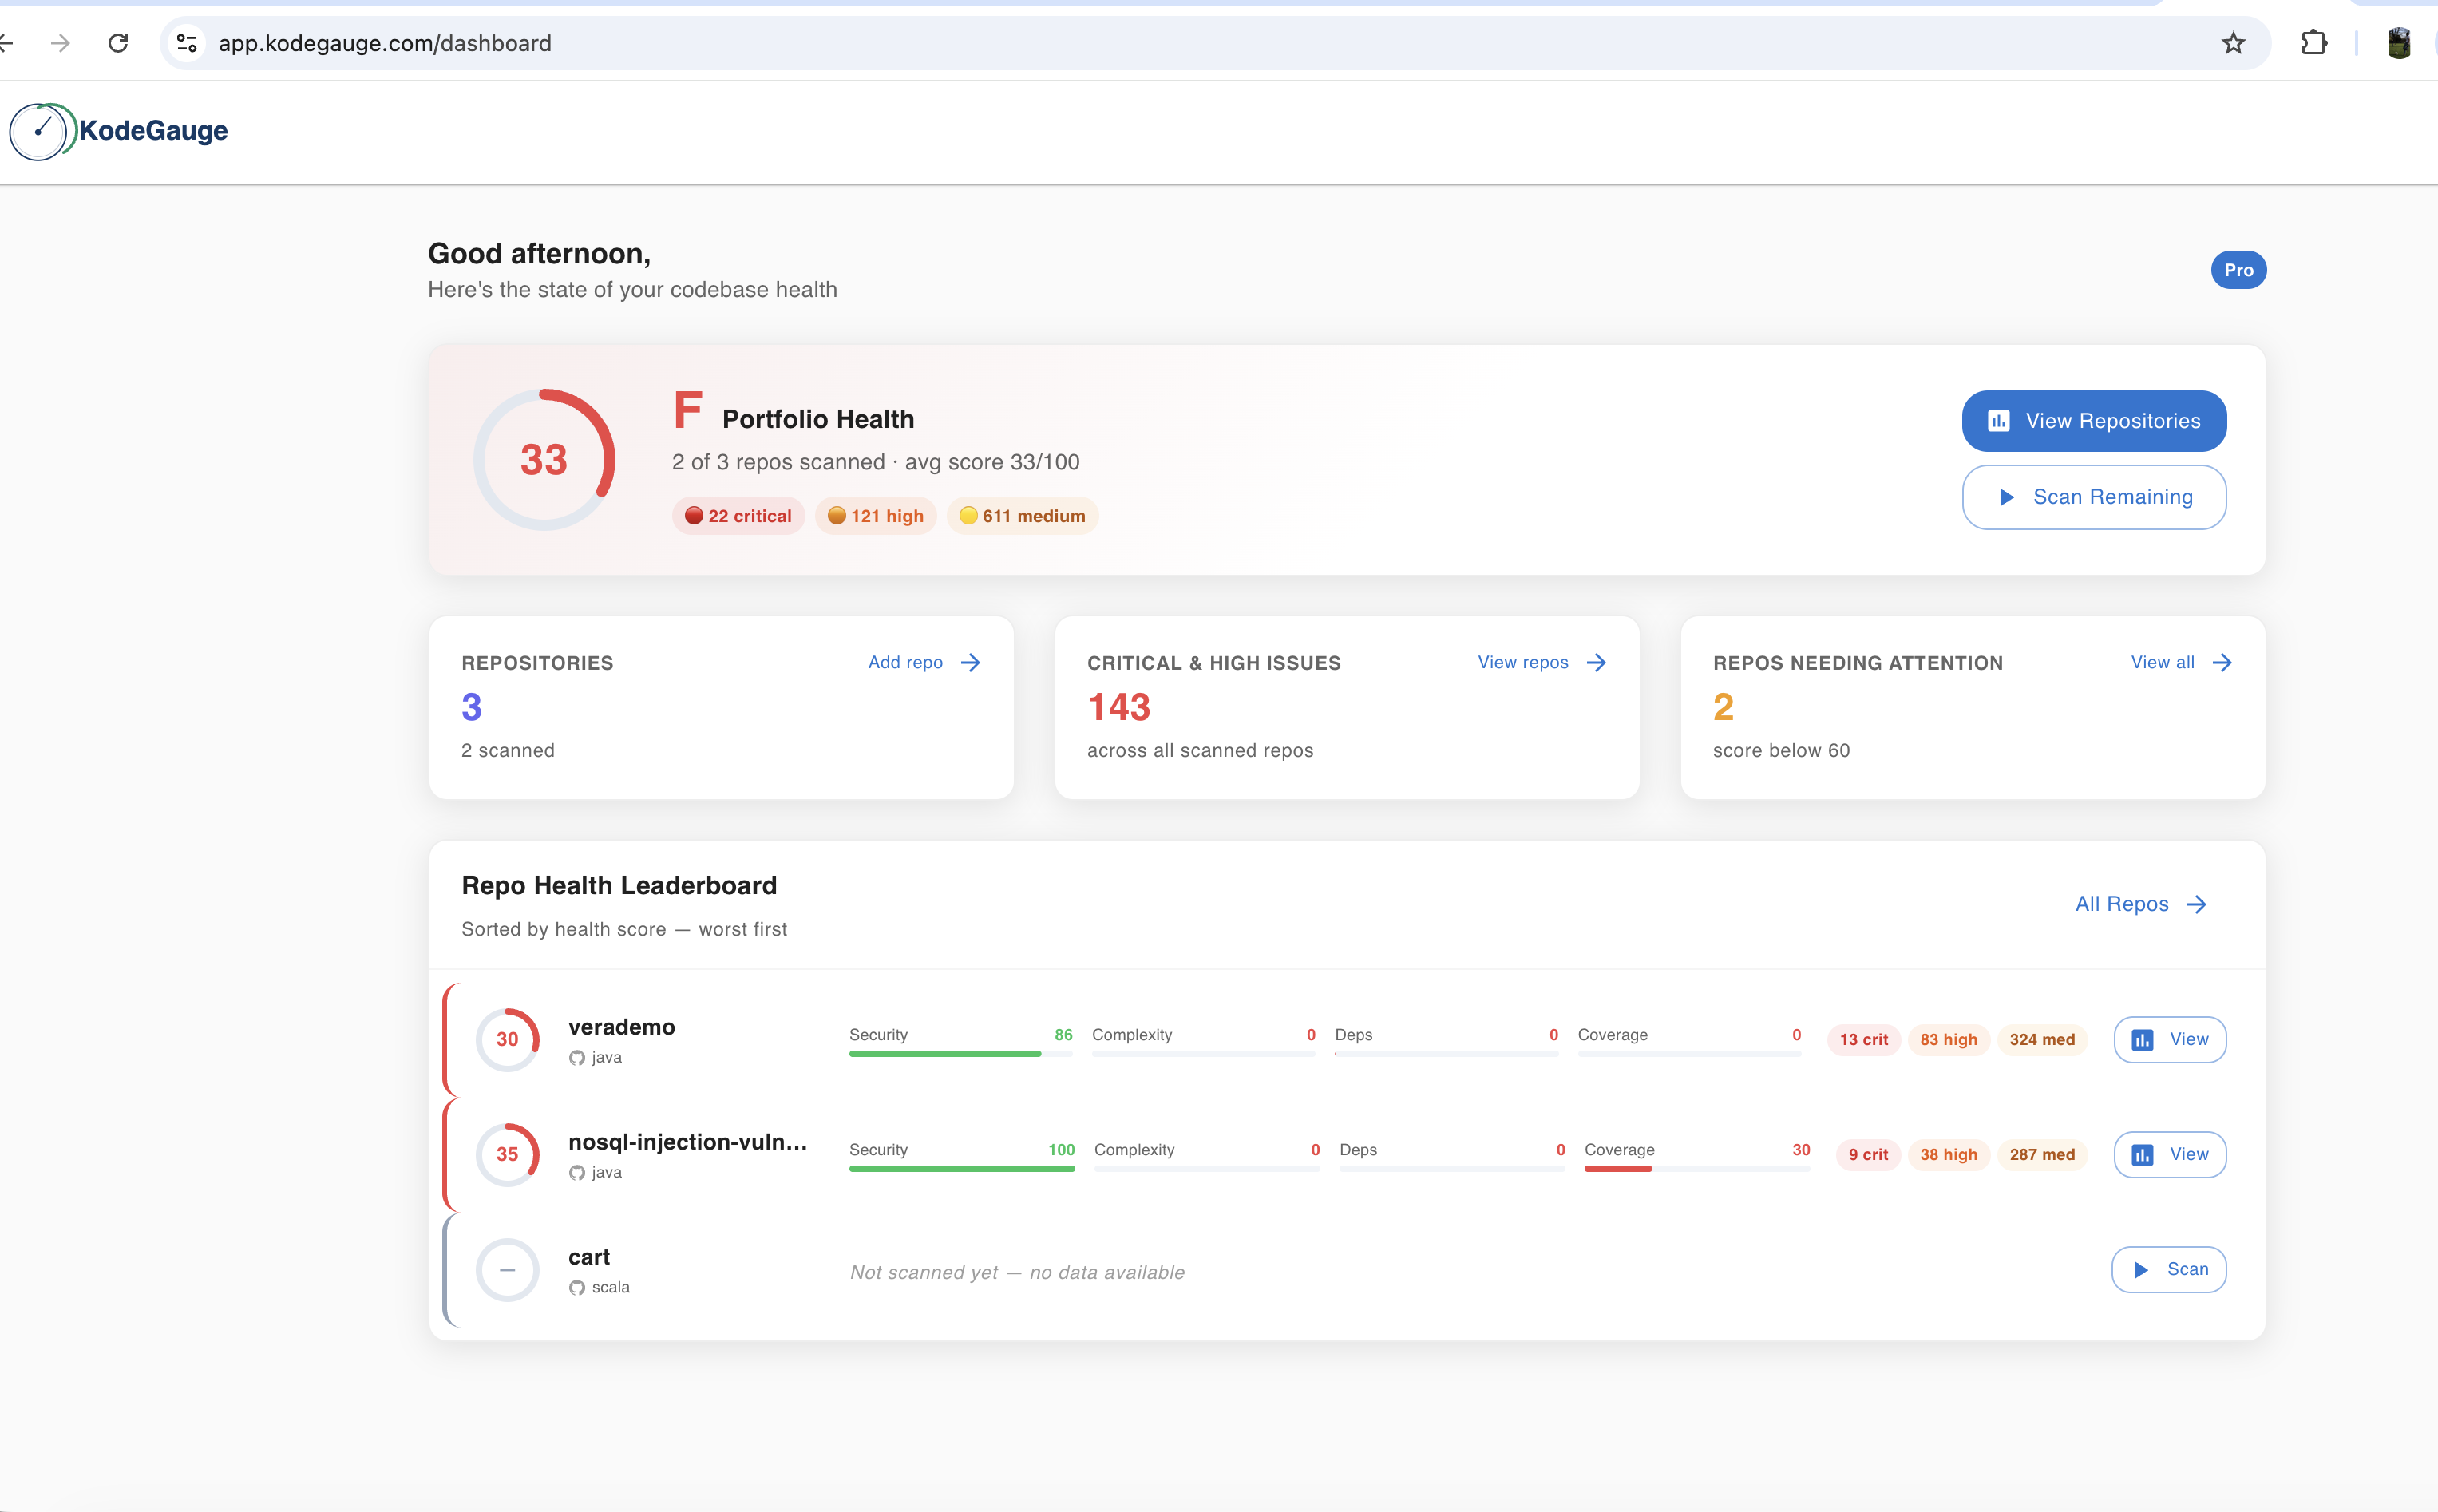
Platform Dashboard
Your repository at a glance.
The dashboard gives you a single view of repository health, cost baseline, carbon footprint, and improvement opportunities — in language both engineers and executives understand.
- Repository health score (overall and by dimension)
- Infrastructure cost estimate and trend
- Carbon footprint and efficiency opportunity summary
- Top cost-reduction opportunities
- Critical bottlenecks and fix priority
- Scan history and trending
- Recent issues, fix order, and expected impact
KodeGauge Dashboard
Inside The Product
Show the interface like a story, not a slideshow.
Each screen should earn its place: portfolio visibility, prioritized findings, quantified savings, carbon impact, and capacity insight.
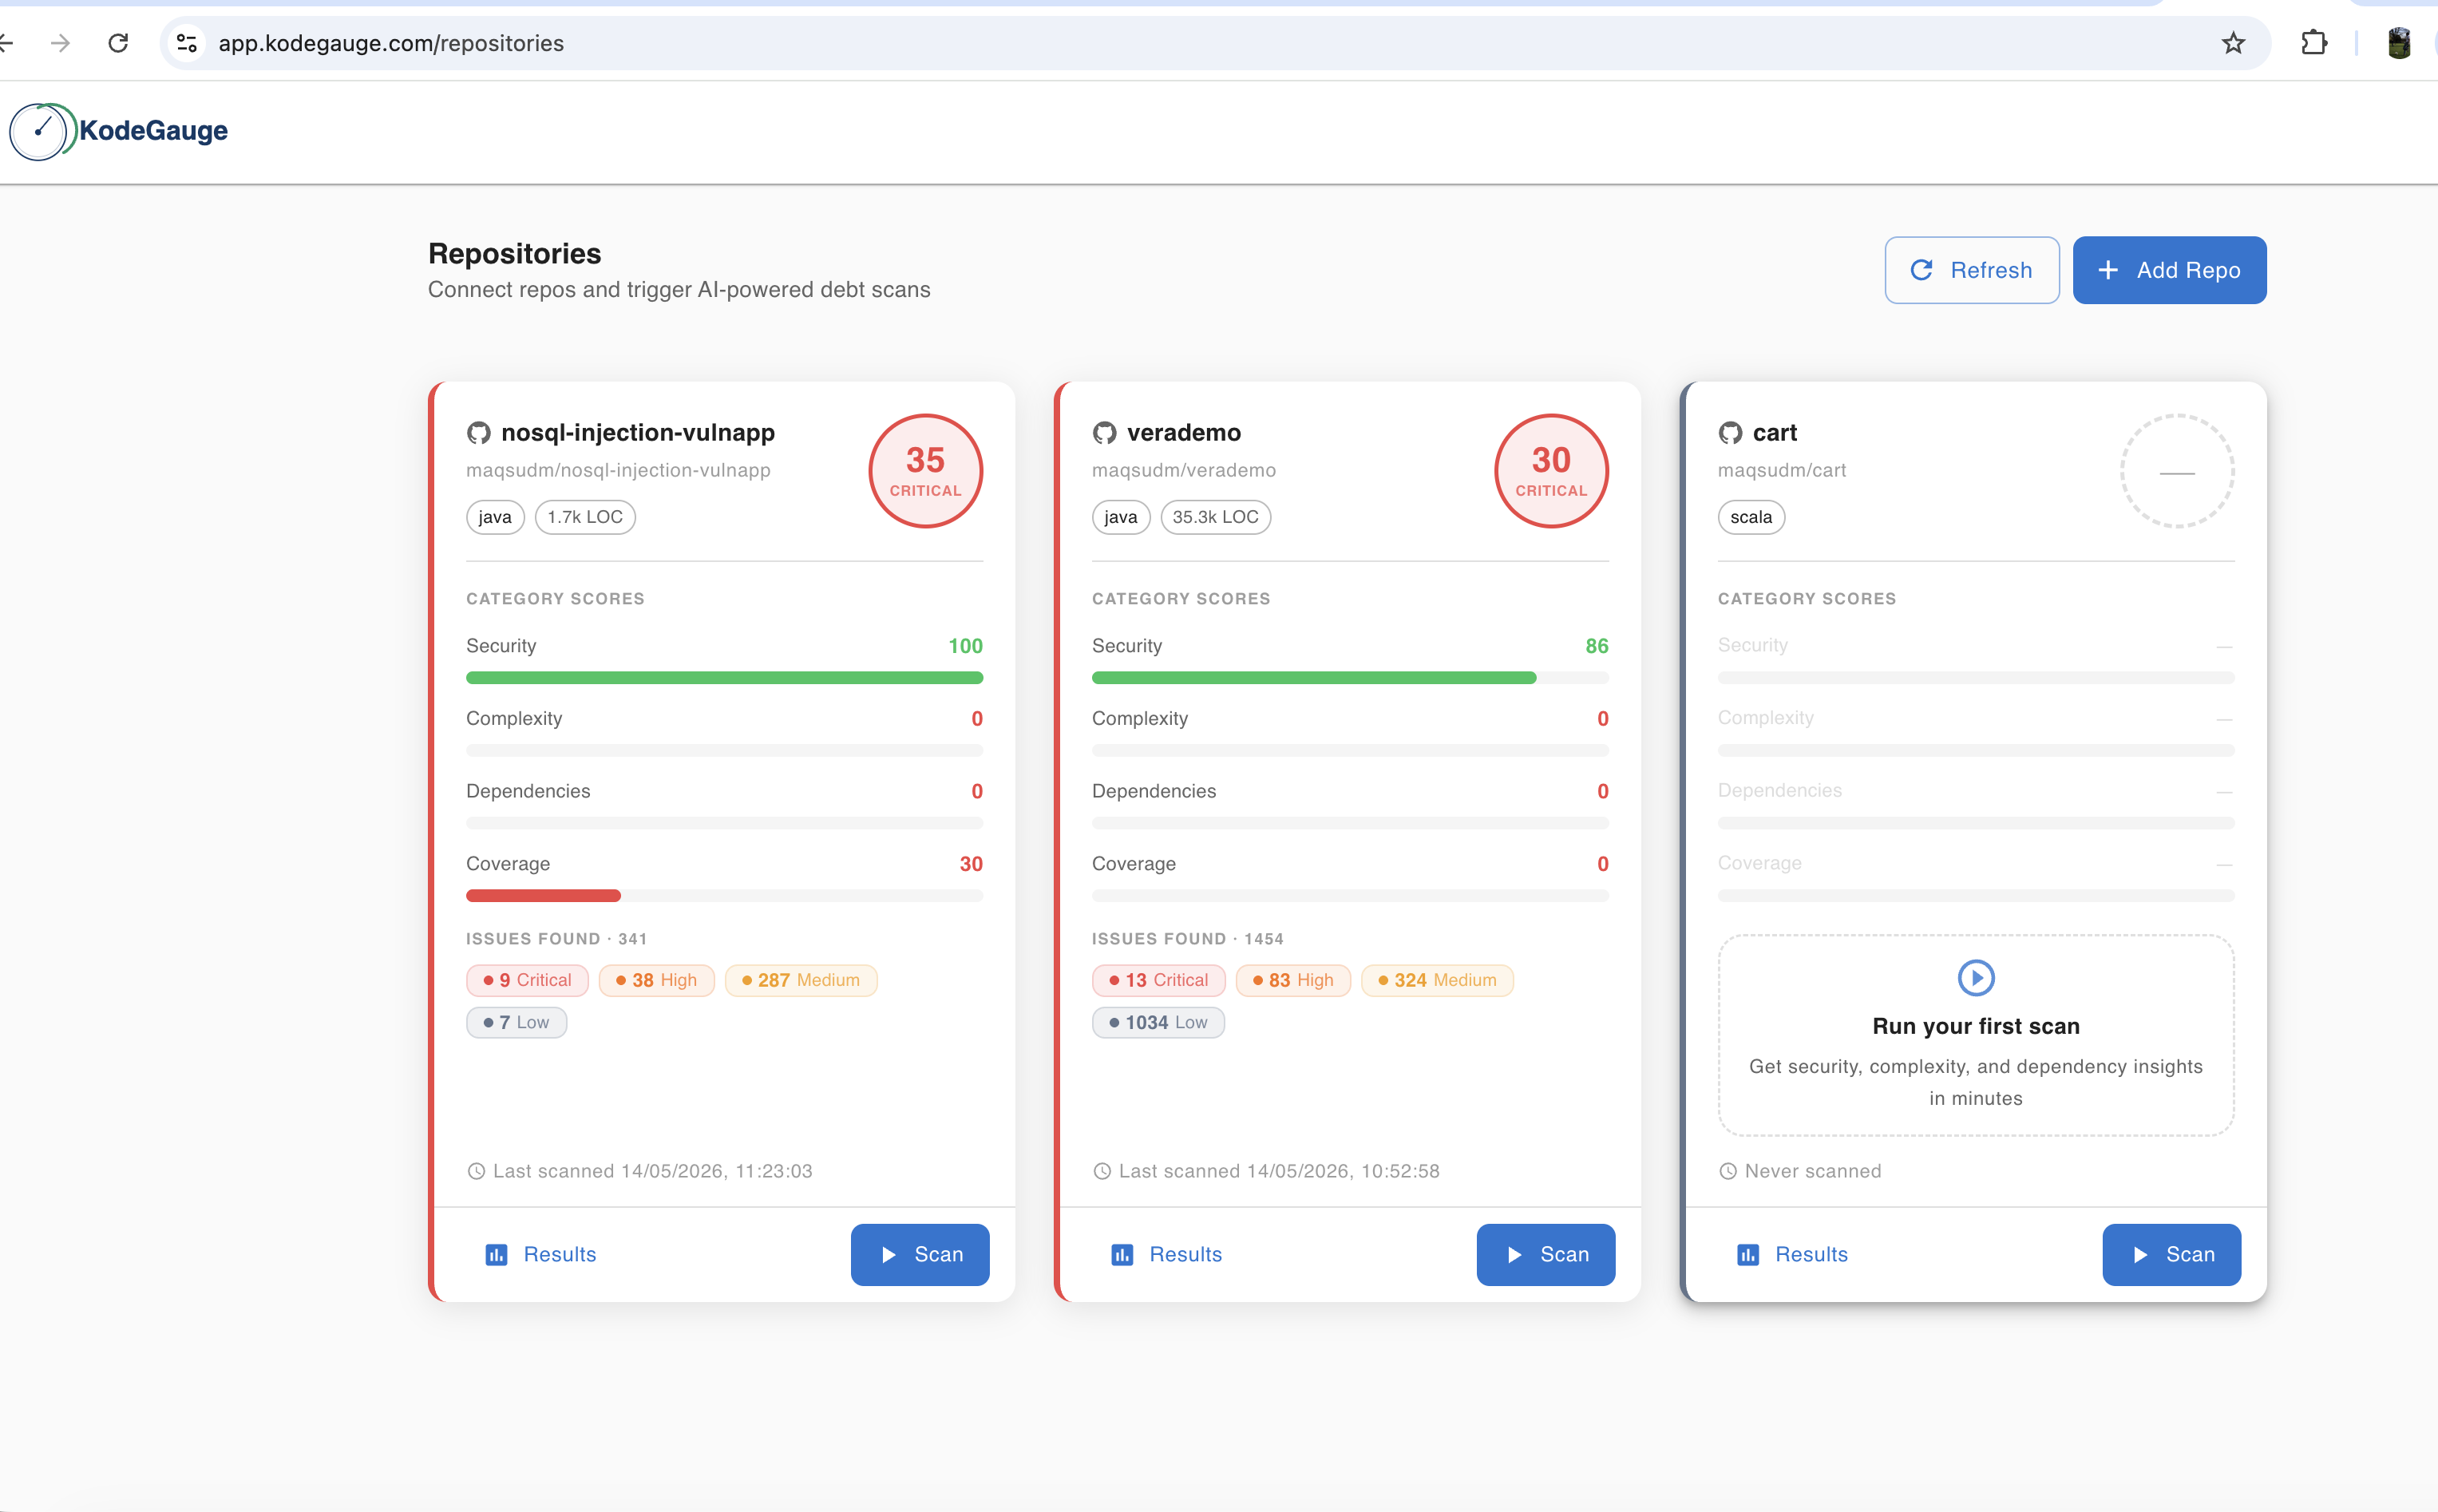
Repository Portfolio
See every repository before you open a single pull request.
A portfolio view should answer health, ownership, and risk at a glance. This screen does that without turning into a spreadsheet.
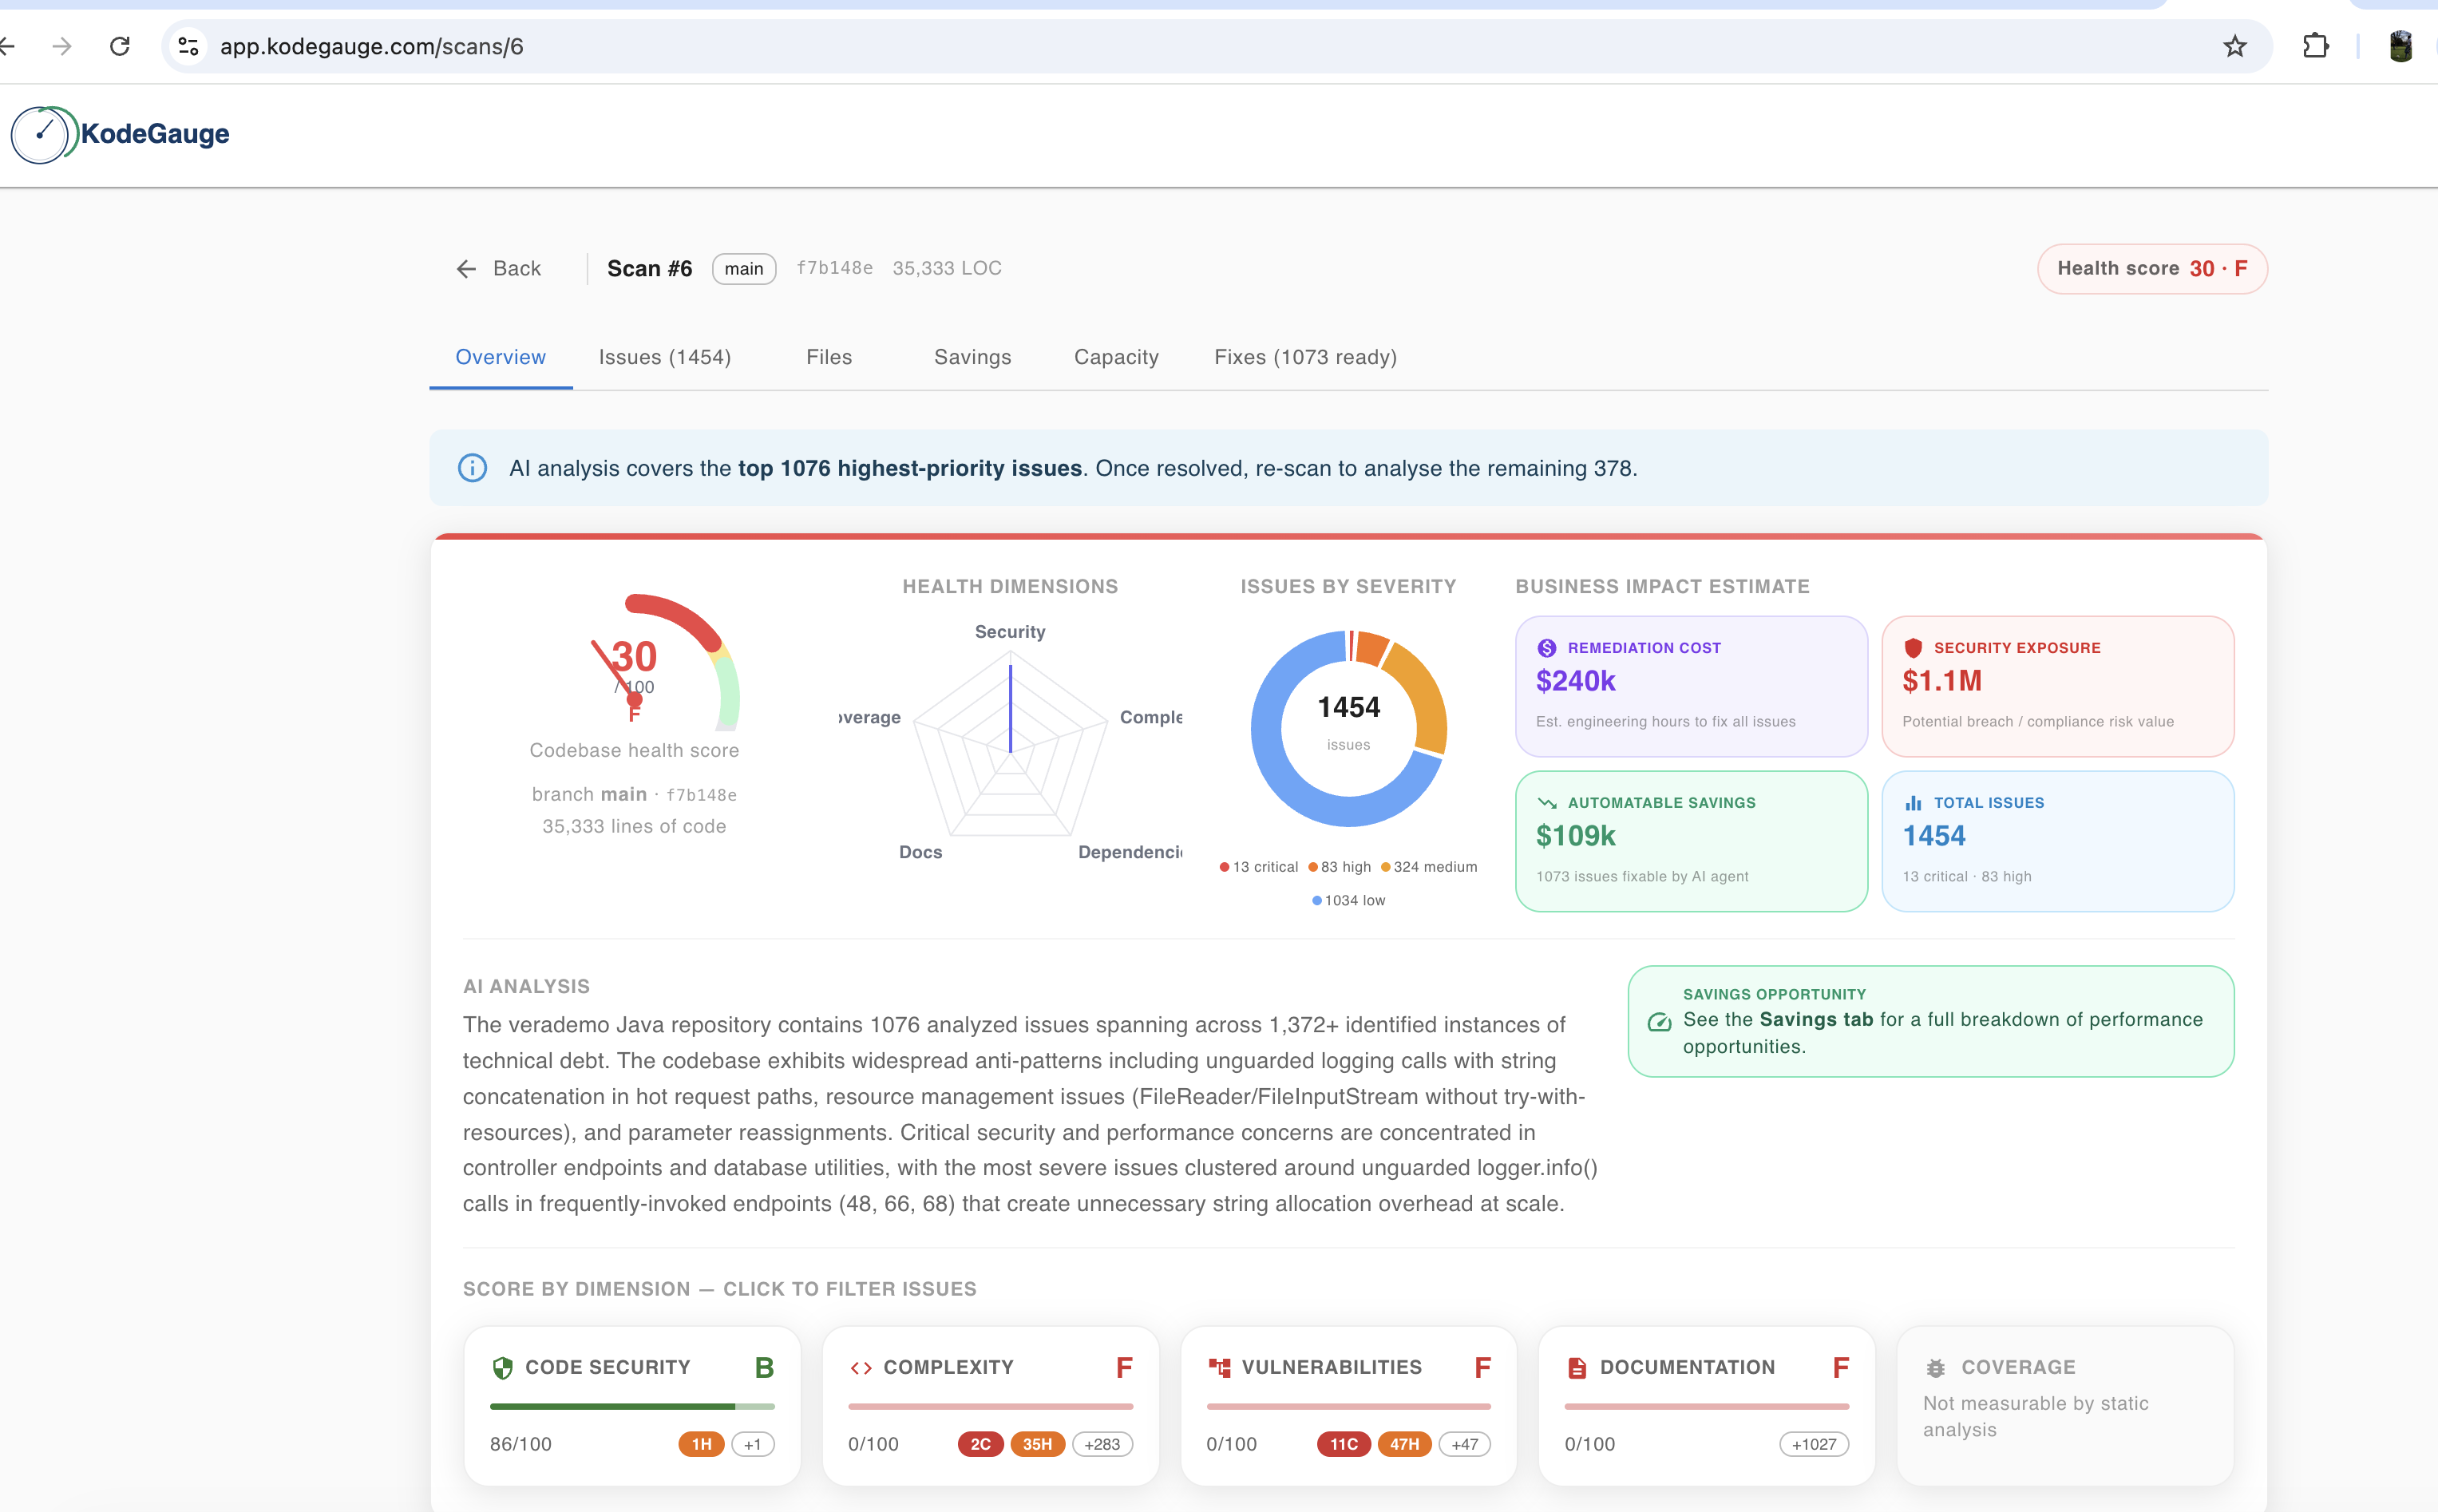
Prioritised Findings
Lead with what matters, not with noise.
The first report screen should immediately show severity, business impact, and what to fix first. Users should feel guided, not buried.
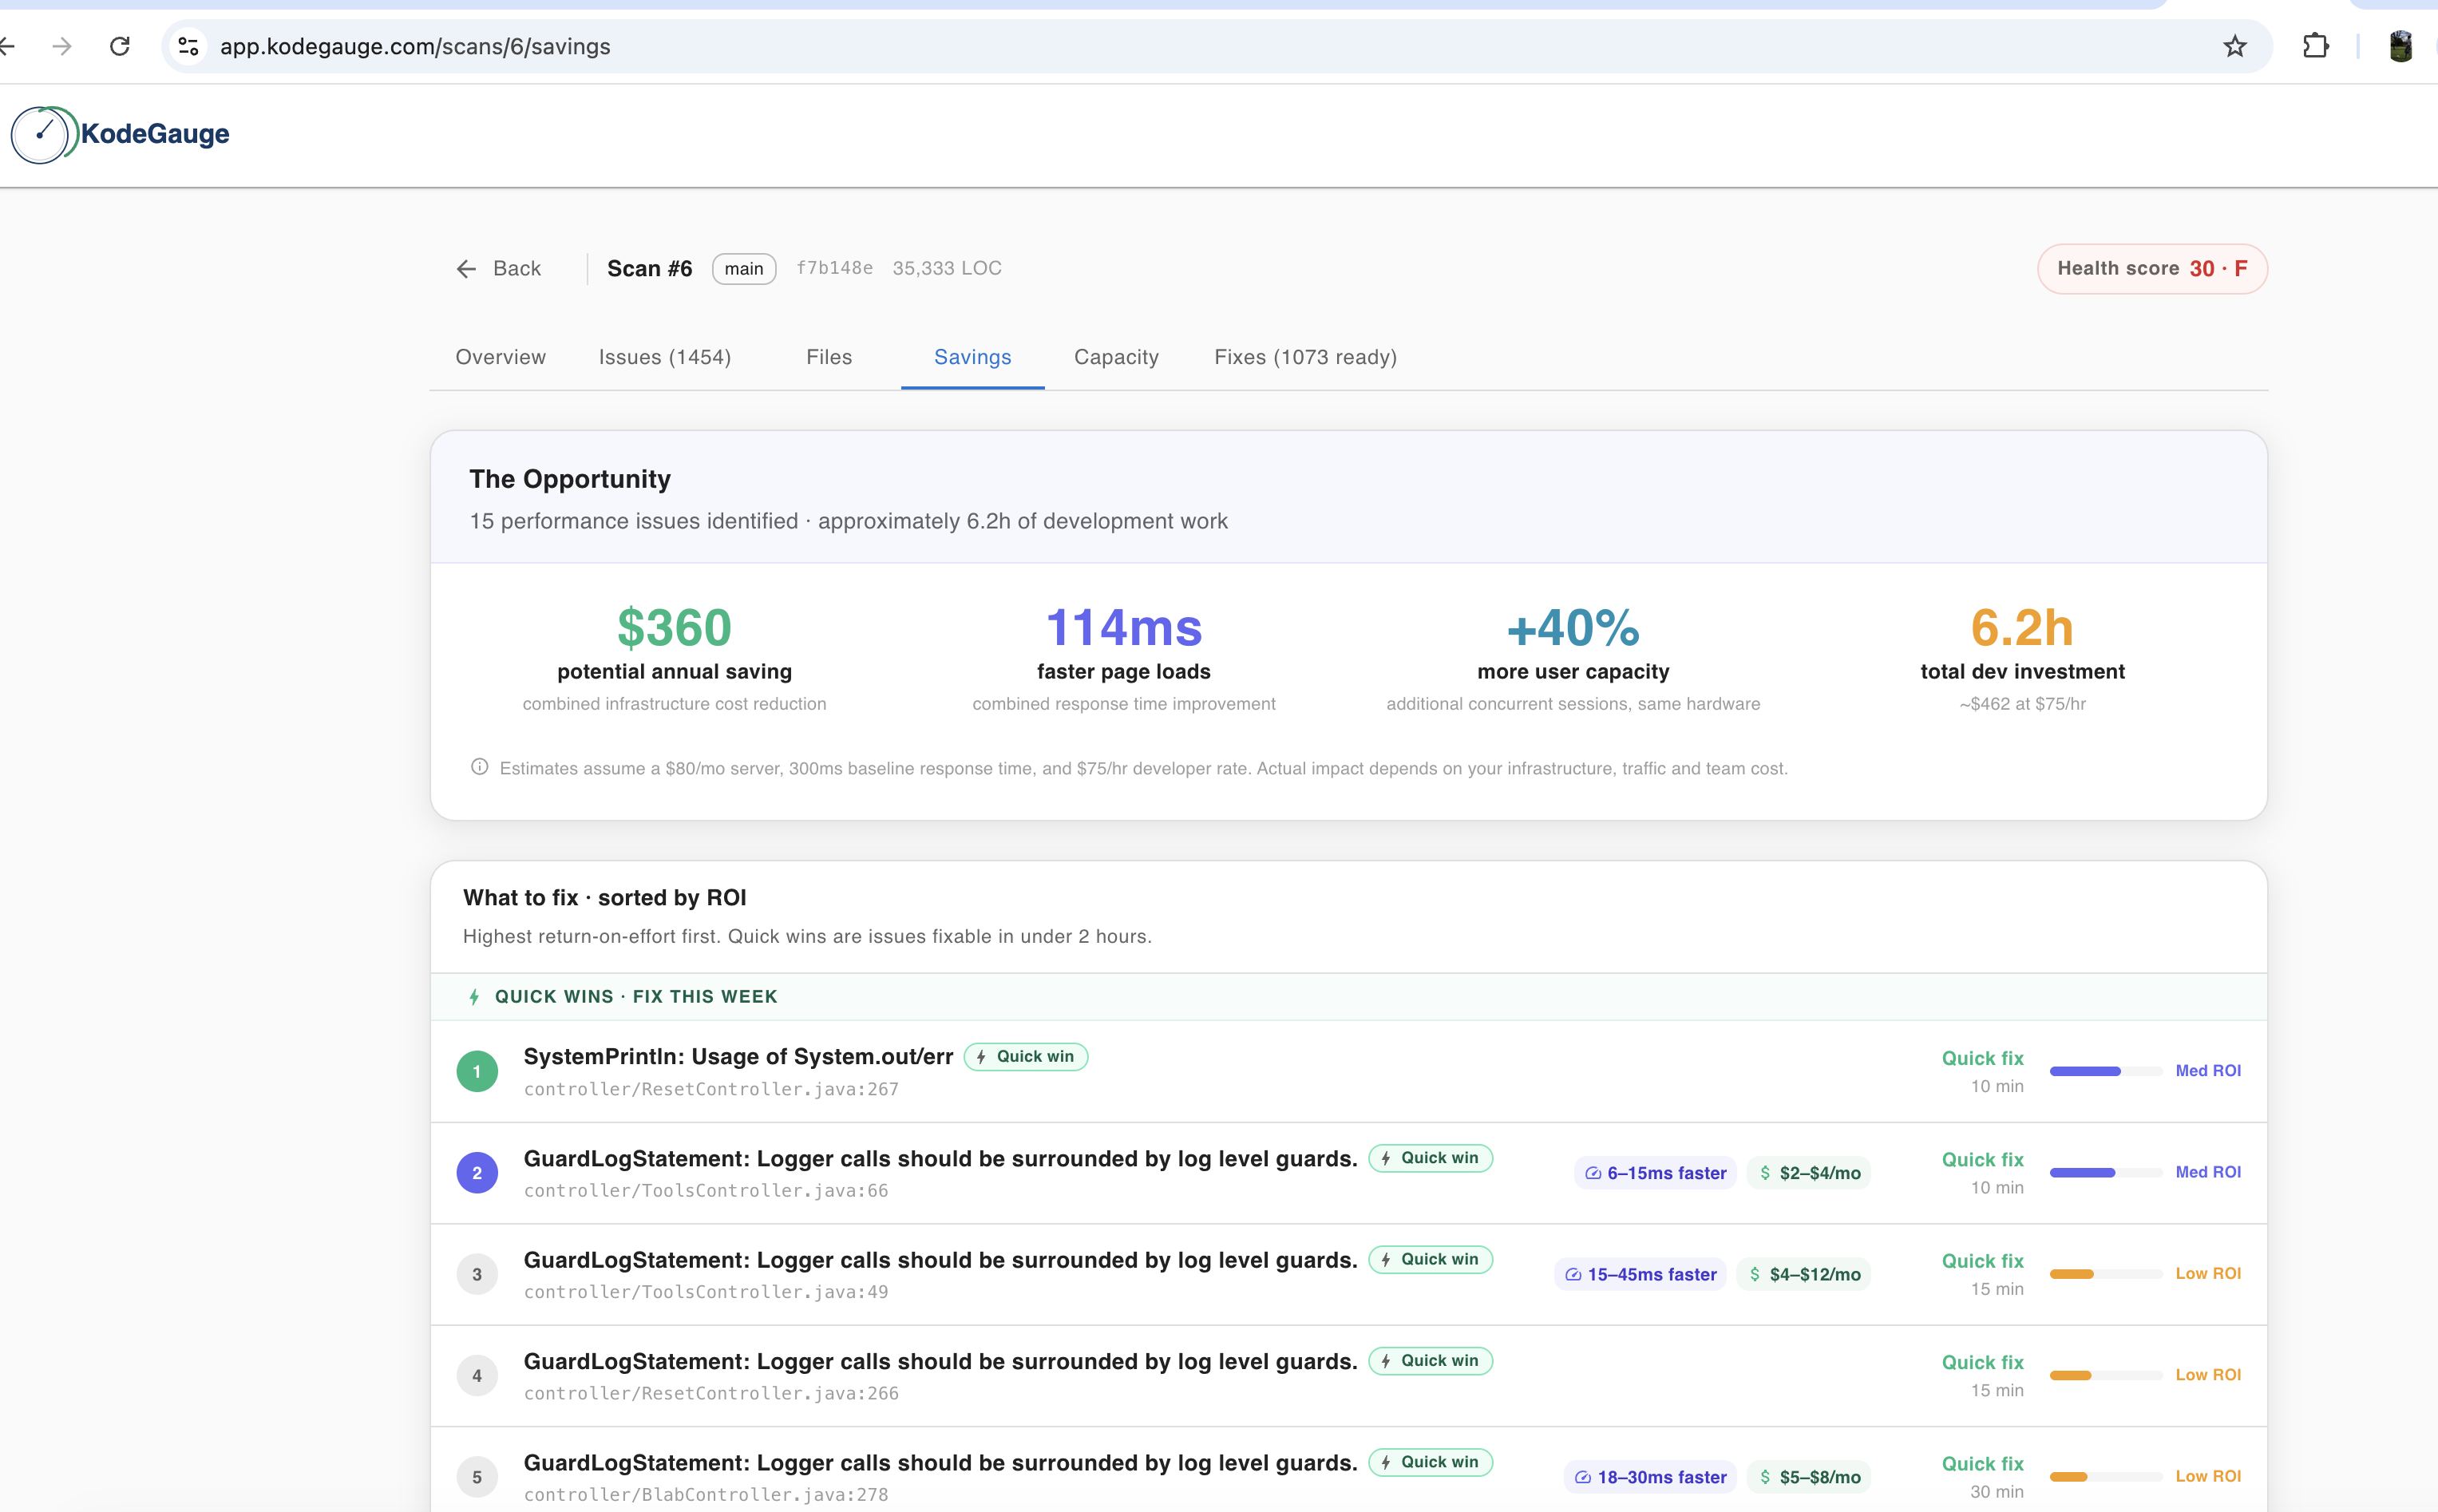
Cost + Carbon Narrative
Turn engineering problems into an efficiency story.
This is where the product earns executive attention. The same screen should show that technical issues are translated into cost, exposure, ROI, and now carbon waste that can be reduced through remediation.
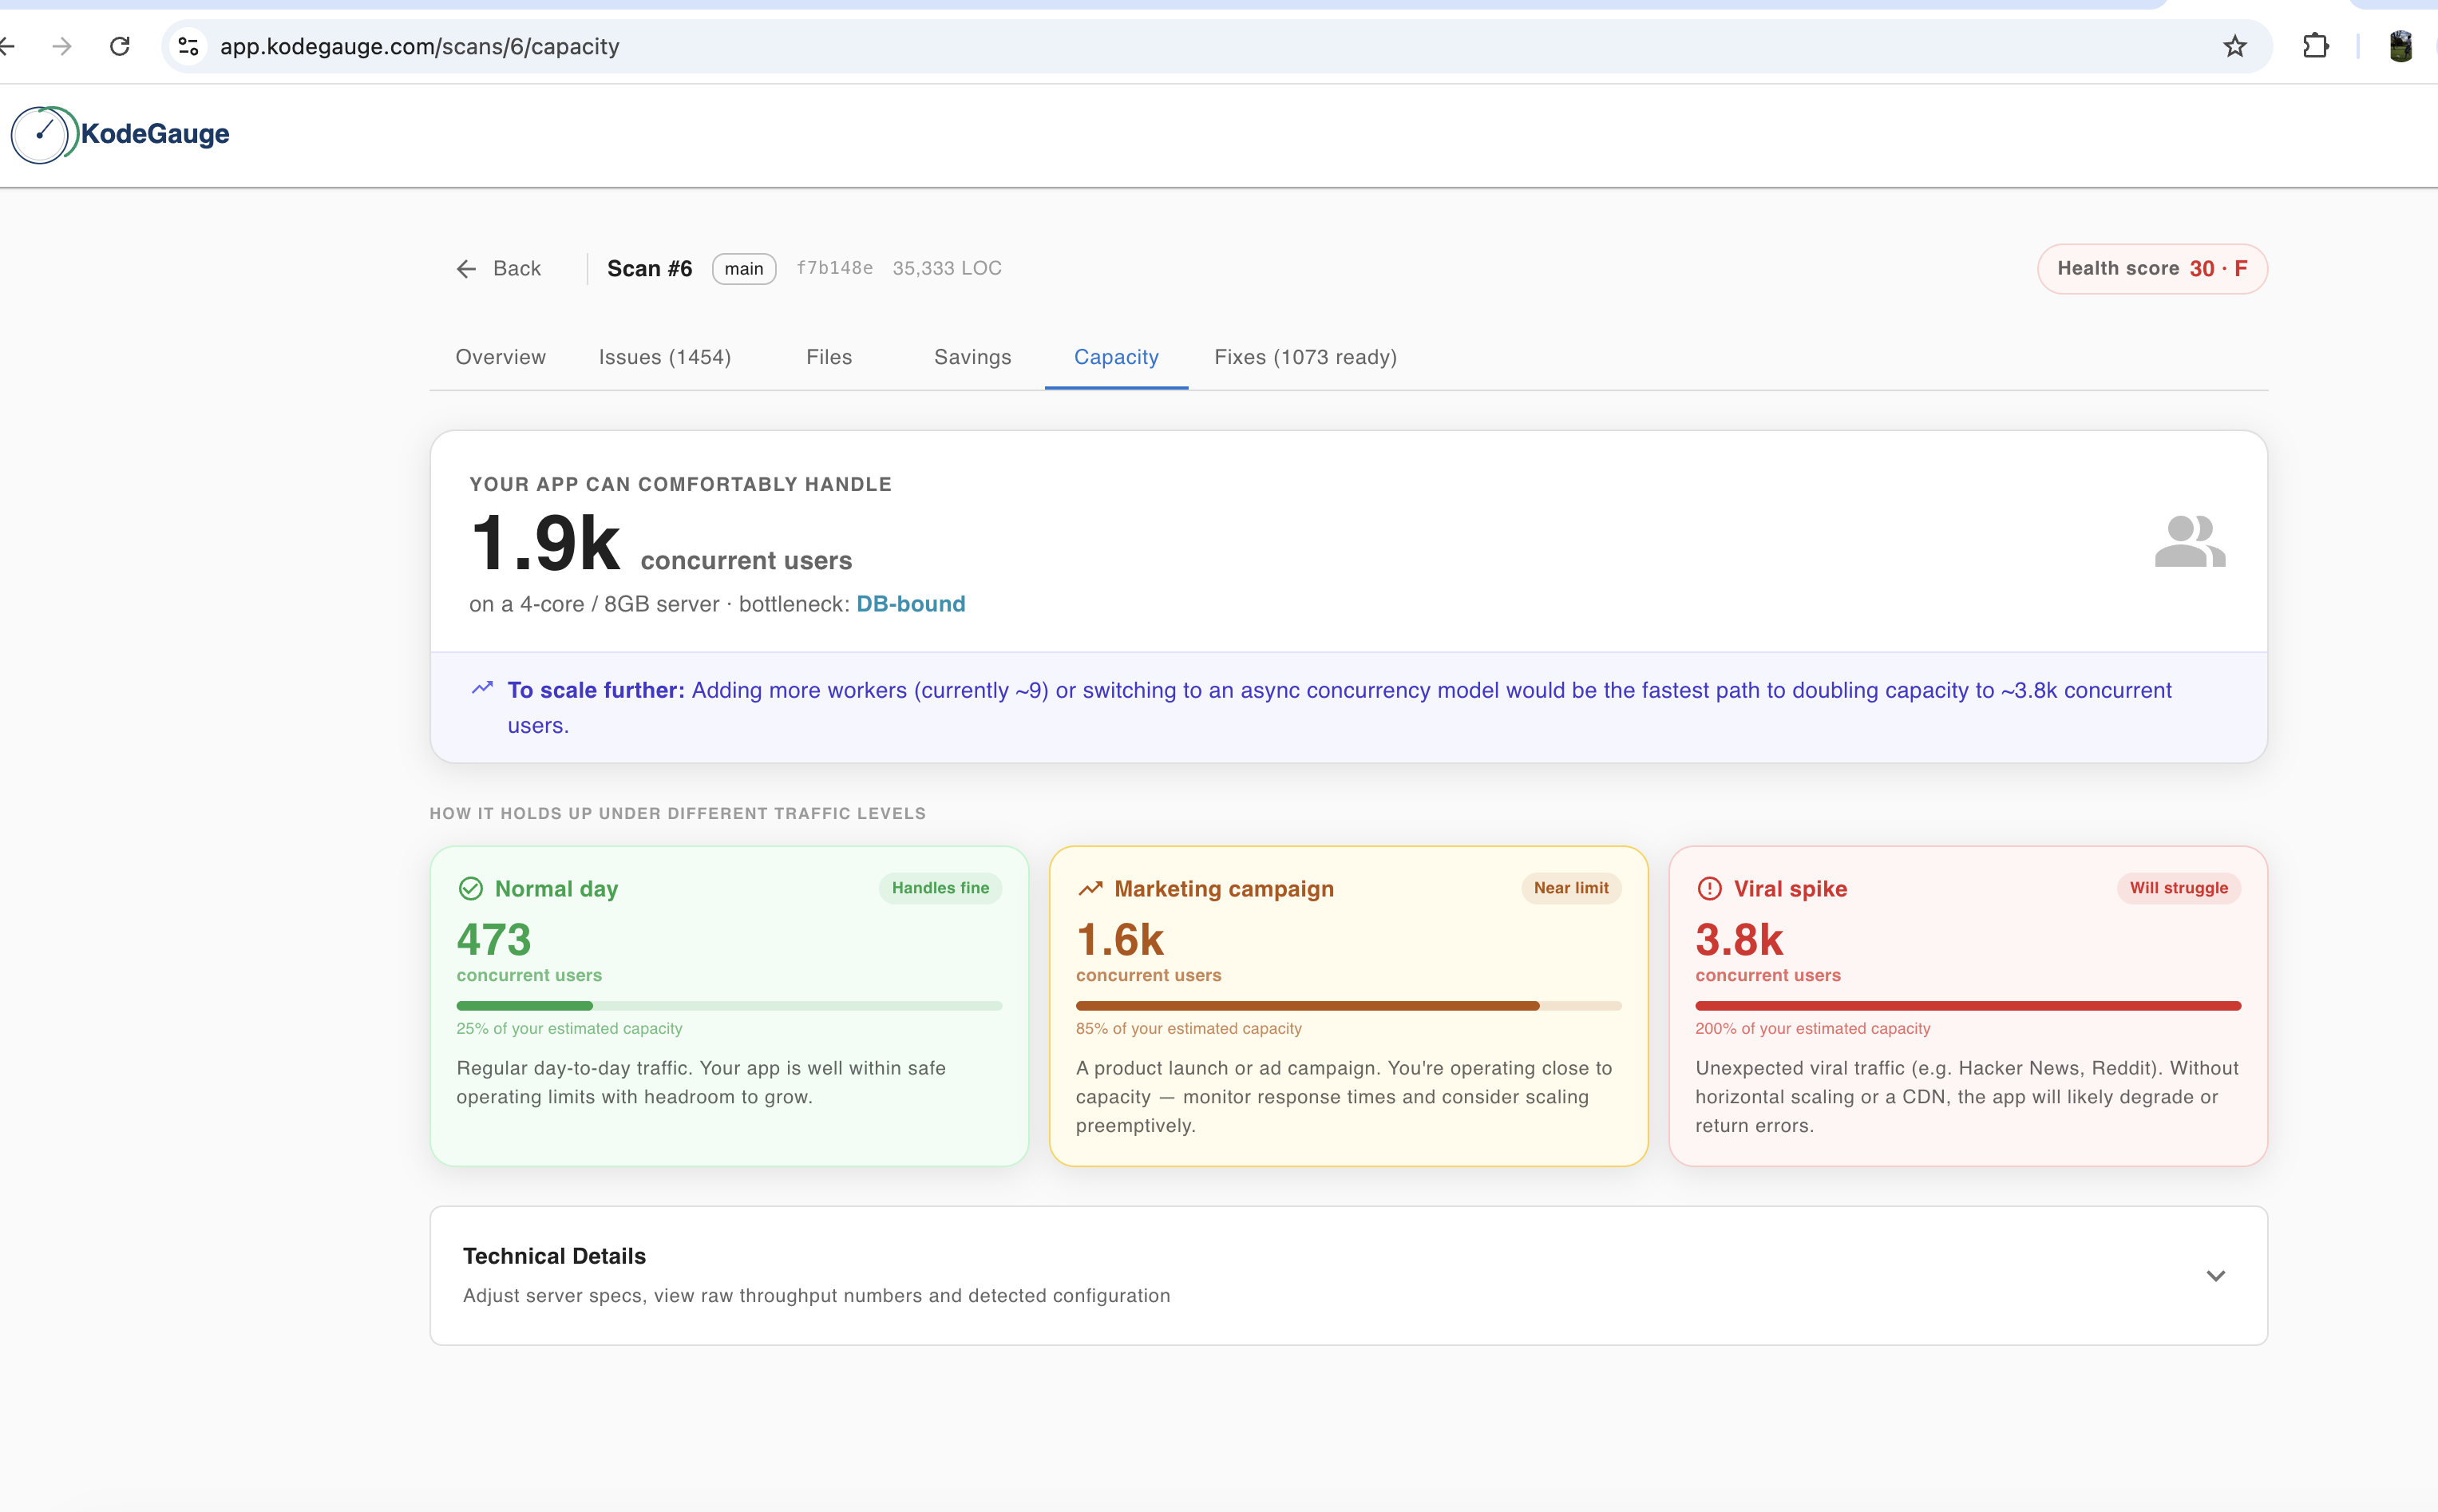
Capacity Insight
Show the scaling ceiling before production finds it for you.
Performance risk is compelling when it becomes concrete. This screen should communicate where throughput breaks and why it breaks.
Know your code. Control your costs. Reduce your risk.
Get a clear picture of repository health, infrastructure efficiency, and technical debt impact in one scan.
No credit card required · Free tier available · Setup in minutes